
Yield Analyzer
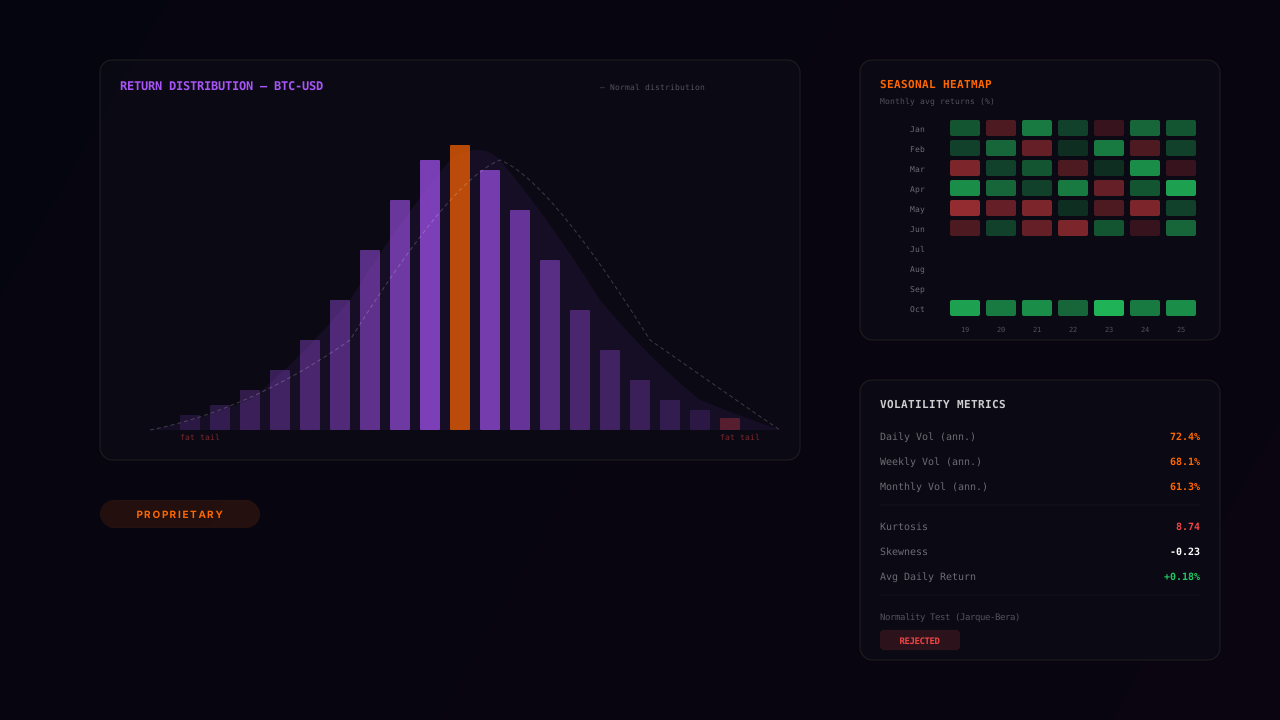
Quantitative financial return analysis tool built on Polars for high-performance columnar processing and Numba for JIT-compiled statistical calculations. Simple and logarithmic returns, multi-timeframe annualized volatility (daily, weekly, monthly, quarterly), distribution analysis with kurtosis and skewness, normality tests (Jarque-Bera) and seasonal analysis by month/quarter. Interactive Plotly visualizations with probability histograms and seasonal heatmaps. Applied to crypto and traditional assets.
The problem
Comparing two assets by looking at performance alone is the fastest way to a bad decision: without volatility, distribution shape and seasonal behaviour, two curves that end at the same point may have demanded completely different tolerance along the way.
How we tackled it
The tool computes simple and log returns and annualised volatility across timeframes — daily, weekly, monthly, quarterly — alongside distribution analysis: kurtosis and skewness, Jarque-Bera normality tests, seasonality by month and quarter. It's the tails, not the average, that decide whether a strategy is survivable.
Technical choices
Polars for columnar processing and Numba for JIT-compiled statistics, SciPy for the tests, Plotly for interactive probability histograms and seasonal heatmaps, yfinance for data. Applied to both crypto and traditional assets, with identical statistical treatment so the comparison actually means something.
What it includes
Simple and log returns, annualised volatility across four timeframes, distribution analysis with kurtosis and skewness, Jarque-Bera normality tests, seasonal breakdown by month and quarter, probability histograms and interactive heatmaps. The same statistical treatment applied to crypto and traditional assets, so comparisons actually hold.